Global Witness’s Chart in Focus series is put together by our data investigations team and takes a look at illuminating trends and statistics related to our work on climate change, corporate accountability and digital threats to democracy.
The land underneath Europe contains hundreds of thousands of miles of gas pipelines, transporting fossil gas every day from wells and terminals to power stations, businesses and private homes. For the most part, this process just works. But when things go wrong, the consequences can be catastrophic.
In 2017, for example, a huge explosion at a gas distribution hub in Austria killed one person, injured 21 others and led to Italy declaring a state of emergency due to the resulting shortage. There are effects on the climate, too – the gas sector’s emissions of methane, which can leak from faulty pipelines and is 84 times as potent as carbon dioxide over a 20-year period, account for 0.6% of the European Union’s (EU) total greenhouse gas emissions.When disaster strikes, the catchily named European Gas pipeline Incident data Group (EGIG) takes note. Based in the Netherlands, EGIG is a cooperation between 17 major companies involved in gas transmission in Europe. Its main task is the maintenance of a centralised database of so-called ‘pipeline incidents’, which forms the basis of a report on pipeline safety published every three or four years.
The chart above is taken from EGIG’s most recent report, published in March 2018. Like most of the report’s analysis, it tells a superficially reassuring story: pipeline incidents are a real problem, which is why EGIG exists, but in the long term things are getting better. Most failures happen to old, out-of-date infrastructure from decades gone by – there’s little to worry about with the systems being rolled out today.
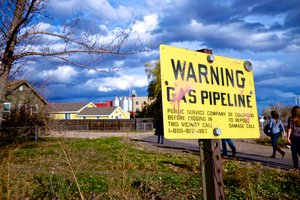
A warning sign for a gas pipeline in Fort Collins, Colorado. Photo credit: Max Elman via Flickr
Look closer, though, and questions arise. What caused pipelines laid between 1974 and 1983 to suffer so many holes and ruptures? More pressingly, what is it about pipelines laid from 2004 to 2013, just seven years ago, that has led to such a large number of cracks, spoiling the otherwise unblemished record of infrastructure from the past three and a half decades?
Sadly, the answers aren’t contained in EGIG’s 2018 report, which is detailed and descriptive but rarely analytical: it tells us what goes wrong, but doesn’t generally get into why. Since EGIG doesn’t make its database public, the report is our only window into the data – and it’s a small one.
As an association of private companies, EGIG isn’t subject to Europe’s freedom of information regulations, meaning that it doesn’t have to reveal anything it doesn’t want to. This lack of transparency has even affected national authorities such as the UK’s Health and Safety Executive, which noted in a 2015 report that it had put in a request for EGIG data to no avail.
If new infrastructure is going to be developed and rolled out, the least we can do is ensure that it’s properly monitored for safety
Global Witness would like to see a complete stop to new gas infrastructure projects in the EU. But if new infrastructure is going to be developed and rolled out, the least we can do is ensure that it’s properly monitored for safety.
The full EGIG database, which stretches back to 1970, could be a hugely valuable resource – not only for campaign groups, but for academics and policymakers, who could take a thorough look at historic incidents and use them to improve safety in the future. With the data under lock and key, it’s difficult to avoid the conclusion that the industry is marking its own homework – just as with European gas demand targets, which are set by a consortium of energy companies and have been routinely overestimated.
We put this situation to the EGIG secretariat and asked for their comments, but did not receive a response.
It doesn’t need to be this way. In the United States, for example, pipeline incidents must be reported to the Pipeline and Hazardous Materials Safety Administration (PHMSA), part of the Department of Transportation, which publishes them in detail on its website. The data is complicated and can be difficult to work with, but at least it’s available.
Open data leads to better analysis, and allows campaign groups and citizens to hold the fossil fuel sector to account. A good example is the work done by FracTracker, a Pennsylvania-based non-profit group, to map and analyse incidents reported to PHMSA. According to FracTracker’s analysis, fires, explosions and other accidents involving pipelines in the US have killed at least 140 people since 2010 and caused almost $5.4 billion of damage.
Skeptics will argue that any industrial process involves a level of risk, and that pipeline incidents are an acceptable price to pay for having access to a cheap and convenient fuel. But in order to assess that risk we need to be able to see it clearly. This means having access to the data – not pre-cooked and parcelled out into charts by the companies who stand to lose most from a full and open discussion of pipeline safety, but in its raw form.
Author
Related to Digital Investigations
-
Press Release | December 06, 2024 TikTok pushes far right candidate content in Romanian election, Global Witness investigation shows

-
Article | December 06, 2024 TikTok fails to enforce its own policies on climate misinformation during COP29

-
Article | November 27, 2024 TikTok still approving election disinformation ads in Ireland